Statements of Income (Fiscal Year)
Language switcher
日本語
English
Millions of yen
| FY2021 | FY2022 | FY2023 | FY2024 | FY2025 | ||
|---|---|---|---|---|---|---|
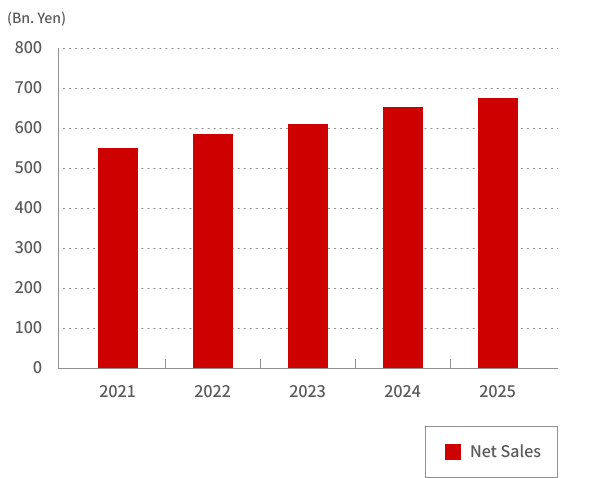
| Net sales | 552,085 | 588,132 | 609,473 | 653,919 | 679,799 | |
| Cost of sales | 361,809 | 388,842 | 404,980 | 443,072 | 462,103 | |
| Gross profit | 190,276 | 199,289 | 204,492 | 210,847 | 217,695 | |
| Selling, general and administrative expenses | 150,576 | 149,341 | 151,997 | 157,723 | 159,507 | |
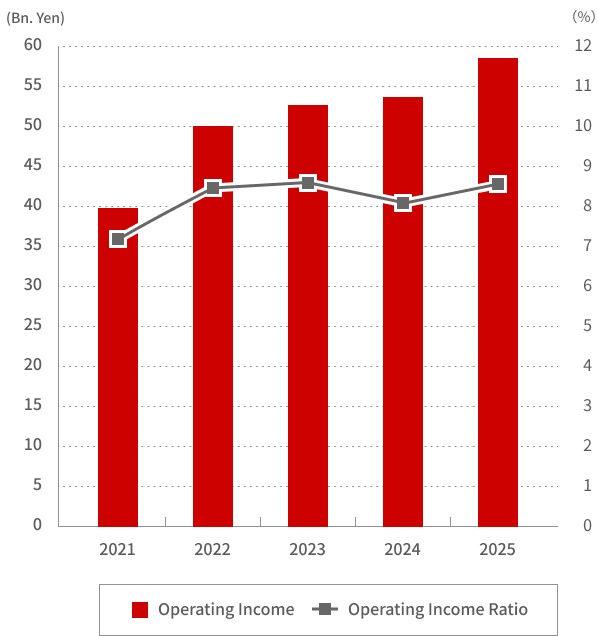
| Operating income | 39,699 | 49,947 | 52,495 | 53,123 | 58,188 | |
| Non-operating income | ||||||
| Interest income | 274 | 299 | 383 | 374 | 457 | |
| Dividend income | 283 | 209 | 237 | 402 | 329 | |
| Insurance income | 506 | 459 | 457 | 455 | 477 | |
| Gain on investments in partnership | 278 | - | - | 105 | 475 | |
| Foreign exchange gains | - | 29 | - | 200 | 68 | |
| Other, net | 220 | 227 | 213 | 229 | 331 | |
| Total non-operating income | 1,562 | 1,225 | 1,291 | 1,768 | 2,139 | |
| Non-operating expenses | ||||||
| Interest expense | 12 | 12 | 11 | 75 | 71 | |
| Investment partnership management expenses | - | - | - | 188 | 203 | |
| Commission for purchase of treasury stock | - | - | - | 53 | 5 | |
| Loss on investments in partnership | - | 29 | 31 | - | - | |
| Foreign exchange losses | 6 | - | 6 | - | - | |
| Other, net | 146 | 139 | 152 | 179 | 207 | |
| Total non-operating expenses | 165 | 180 | 201 | 497 | 488 | |
| Ordinary income | 41,096 | 50,991 | 53,585 | 54,393 | 59,839 | |
| Extraordinary income | ||||||
| Gain on sales of long-lived assets | 6 | 3 | 3 | 2 | 0 | |
| Gain on sales of investments in securities | 1,255 | 729 | 113 | 22 | 1,705 | |
| Gain on sales of shares of subsidiaries and associates | 895 | - | - | 2,876 | - | |
| Insurance income due to disaster | 202 | - | - | - | - | |
| Other, net | 16 | 0 | - | 9 | - | |
| Total extraordinary income | 2,376 | 733 | 117 | 2,910 | 1,706 | |
| Extraordinary losses | ||||||
| Loss on sales and disposal of long-lived asset | 124 | 124 | 479 | 156 | 139 | |
| Impairment loss | - | - | - | - | 494 | |
| Loss on sales of shares of subsidiaries and associates | 40 | - | 159 | - | - | |
| Loss on sales of investments in securities | - | 18 | 2 | - | 226 | |
| Loss on impairment of investments in securities | 18 | 57 | - | - | 40 | |
| Loss on disaster | 168 | - | - | - | - | |
| Other, net | 26 | 1 | 3 | 0 | 13 | |
| Total extraordinary losses | 377 | 202 | 645 | 156 | 915 | |
| Net income before income taxes | 43,094 | 51,523 | 53,057 | 57,148 | 60,630 | |
| Income taxes-current | 12,971 | 14,244 | 15,493 | 17,452 | 17,969 | |
| Income taxes-deferred | 627 | 1,652 | 980 | 292 | 1,117 | |
| Total income taxes | 13,598 | 15,896 | 16,473 | 17,744 | 19,086 | |
| Net income | 29,495 | 35,626 | 36,583 | 39,403 | 41,544 | |
| Net income attributable to non-controlling interests | 75 | 74 | 90 | 88 | 85 | |
| Net income attributable to owners of the parent | 29,420 | 35,552 | 36,493 | 39,315 | 41,458 | |
-
*
Information in the above tables is based on data from summary reports of consolidated financial results.