Financial Indicators
Language switcher
日本語
English
Financial Indicators
| 2021 | 2022 | 2023 | 2024 | 2025 | ||
|---|---|---|---|---|---|---|
| Total number of common stock issued | Shares | 131,079,972 | 131,079,972 | 131,079,972 | 111,079,972 | 111,079,972 |
| EPS | Yen | 226.88 | 274.16 | 281.41 | 319.79 | 381.46 |
| Stock price at end of fiscal year | Yen | 2,291 | 2,989 | 4,276 | 5,170 | 6,881 |
| PER | Times | 10.10 | 10.90 | 15.19 | 16.17 | 18.04 |
| BPS | Yen | 2,883.74 | 3,081.07 | 3,352.30 | 3,514.60 | 3,850.13 |
| PBR | Times | 0.79 | 0.97 | 1.28 | 1.47 | 1.79 |
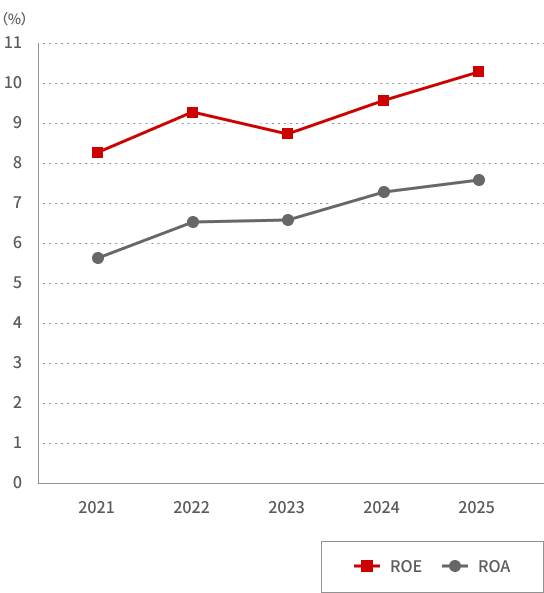
| ROE | % | 8.2 | 9.2 | 8.7 | 9.6 | 10.4 |
| ROA | % | 5.7 | 6.6 | 6.6 | 7.3 | 7.6 |
| Equity ratio | % | 71.0 | 73.5 | 78.0 | 73.0 | 73.1 |

-
*
The information above is based on the summary report of consolidated financial results for each fiscal year.
-
*
Total number of common stock issued includes treasury stock.
-
*
EPS, BPS, ROE, ROA and equity ratio have been calculated on a consolidated basis.
Number of Employees (Consolidated)
unit:person
| 2021 | 2022 | 2023 | 2024 | 2025 | |
|---|---|---|---|---|---|
| Number of employees | 16,220 | 15,973 | 16,089 | 18,395 | 18,425 |
-
*
The number of employees includes senior management and all staff directly employed by the Company.
Please click here to download the data.